
In June 2025, Southwest Power Pool (SPP) published its Summer Resource Adequacy Report and a single row of numbers in it told a story that should concern every market participant in the footprint. The SPP Balancing Authority Area’s capacity above peak load is projected to fall from 20.7% in 2025 to just 1.9% by 2029 and to -1.6% by 20301.
This drop in capacity below the Planning reserve margins (PRM) brings unique opportunity for battery energy storage developers entering SPP as the region confronts a projected 5,950 MW capacity shortfall by 20292 and implements the most significant resource adequacy reforms in its history. SPP’s bilateral market structure, ELCC accreditation at currently lower penetration levels, and rising capacity prices will create favorable conditions for storage projects, but navigating the system requires understanding its distinctive approach to capacity procurement and seasonal requirements.
This article is the first in a three-part series examining the structural dynamics of the SPP market. In this installment, CES provides a comprehensive guide to resource adequacy in SPP— the framework, the numbers, the capacity gap, and what it means for wholesale revenue and what actually makes a megawatt bankable. In Part 2, CES willexamine the interconnection queue that determines whether new resources can actually reach the grid. Lastly in Part 3, CES will explore how large load interconnection is amplifying every challenge we discuss here.
SPP’s resource adequacy structure operates through mandatory bilateral contracting
Unlike PJM or ISO-NE, SPP does not operate a centralized capacity auction. Instead, resource adequacy in SPP is structured as a bilateral obligation framework. The system functions through three interconnected mechanisms: the Resource Adequacy Requirement (RAR), the Planning Reserve Margin (PRM), and a deficiency payment structure that penalizes noncompliance.
Each of SPP’s 64 Load Responsible Entities (LREs) must maintain enough accredited generating capacity to cover its forecasted net peak demand plus a reserve margin. Asinvestor-owned utilities own only 46% of the nameplate capacity in the region3, much of the capacity needed to meet their RAR is sourced through – bilateral contracts with project developers, including battery storage developers
Investor-owned utilities own only 46% of the Capacity in SPP
Capacity Ownership Outlook | MW
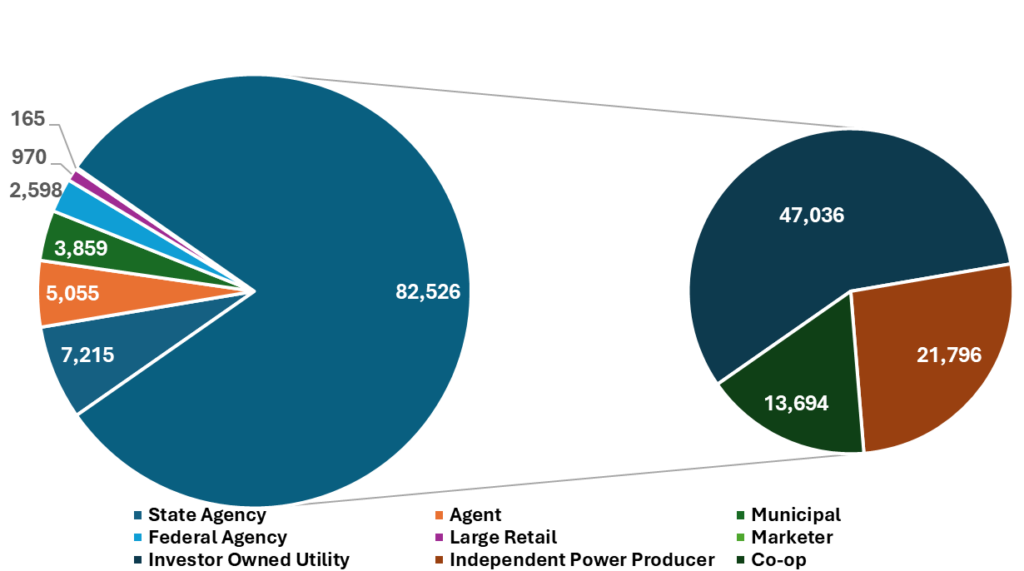
Figure 1: SPP Nameplate Capacity by Market Participant Type
The compliance framework operates on an annual cycle with critical deadlines. LREs must submit their Resource Adequacy Workbook to SPP by February 15 each year, demonstrating they have contracted sufficient accredited capacity for the upcoming summer and winter seasons. SPP reviews submissions through mid-May, after which any entity failing to cure deficiencies faces penalty payments based on the Cost of New Entry (CONE), currently at $85.61/kW-year4 and projected to rise to $139.85/kW-year this year5, reflecting the escalating capital costs of new combustion turbine construction.
The absence of a centralized auction means capacity prices are negotiated bilaterally. As reserve margins tighten and deficiency penalties increase, the RA price trajectory represents significant upside for storage developers.
Planning reserve margins are undergoing historic expansion
After remaining steady at 12% between 2019 to 2022, SPP’s PRM increased to 15% beginning in 2023, with further step-ups to 16% in 2026 and 17% by 2029. In August 2024, SPP’s Regional State Committee and Board of Directors approved transformative changes to planning reserve margins establishing for the first time separate seasonal requirements that dramatically increase winter capacity obligations, 16% PRM in Summer 2026 and 36% PRM in Winter 2026-27.
PRM Steps up from 12% Historically to 17% by 2029; Winter Margin Reaches 36%
SPP PRM Outlook | %
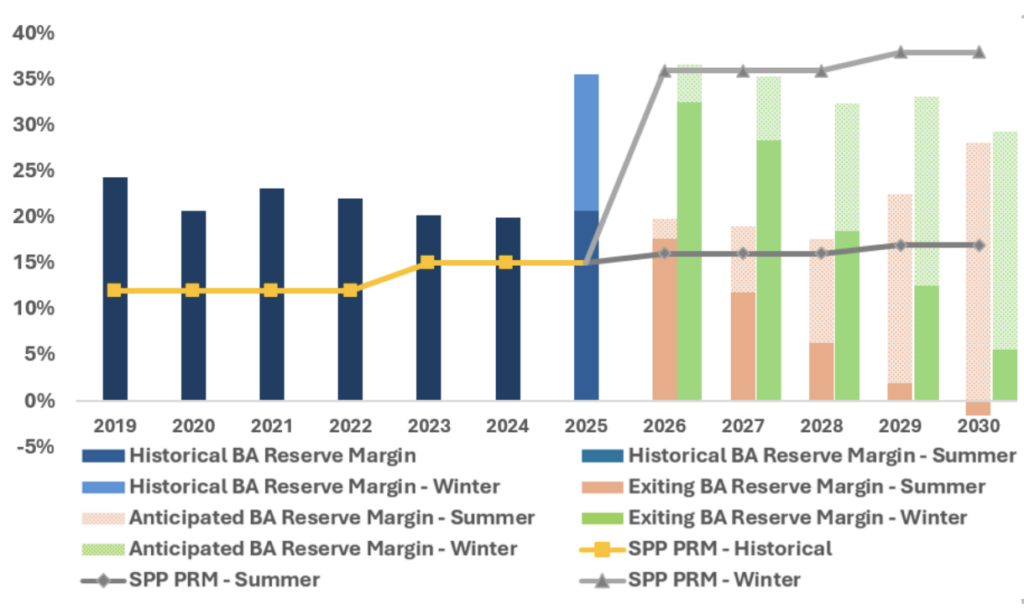
Figure 2: SPP BA Area Reserve Margin Summary
The 36% winter PRM reflects lessons from Winter Storm Uri (2021) and Winter Storm Elliott (2022), which exposed vulnerabilities in the conventional generation fleet during extreme cold. Winter reliability now dominates SPP’s planning decisions due to risk of extended heating-driven load plateaus and temperature-correlated generator outages. These events can create multi-day stress events that differ fundamentally from summer’s brief evening peaks.
FERC approved these seasonal requirements in November 2024,6 though the winter framework faced initial rejection in December 2023 before SPP submitted a revised filing. The new seasonal structure creates distinct implications for energy-limited resources like battery storage, as winter accreditation values are substantially lower than summer values due to the extended duration of winter reliability stress events.
With the distinct PRM framework established for summer and winter, SPP is still facing a resource adequacy challenge as highlighted in the – 2025 Summer and Winter resource adequacy reports. As per the summer RA report, SPP’s existing resource base, without anticipated new generation, declines from approximately 67,838 MW of total capacity in 2025 to 62,819 MW by 2030, a reduction driven primarily by the retirement of 3,645 MW of coal and natural gas resources.7 At the same time, the required PRM itself is increasing, which results in a widening gap that will reach a capacity deficit by 2027, when the projected reserve margin of 11.8% falls below the newly established 16% summer requirement.
SPP Capacity Falls ~5 GW by 2030 as 3.6 GW of Thermal Retirements Pressure Summer Reserves SPP 2025 to 2030 Summer Season Outlook | MW
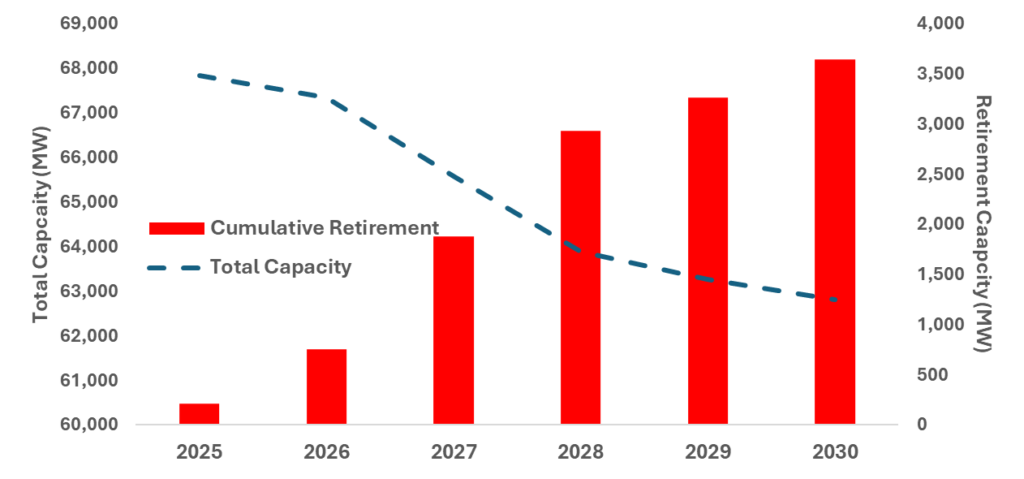
Figure 3: SPP Total Capacity vs. Cumulative Retirements (Summer)
The winter RA report reinforces this picture. Winter-specific retirements of 4,143 MW of coal and natural gas capacity by the end of 20308. With the new 36% winter PRM requirement taking effect in 2026-2027, LREs face a significantly expanded obligation to secure winter-season capacity, a requirement that many are encountering for the first time.
ELCC methodology determines battery capacity credit with duration-based tiers
Not all megawatts count equally in SPP’s resource adequacy framework. The accredited capacity a resource can sell into the RA market depends on its technology type. SPP implemented Effective Load Carrying Capability (ELCC) methodology for battery storage accreditation effective June 1, 2023, following FERC approval on July 18, 2024.9 The ELCC approach quantifies how much additional load a storage resource can reliably serve while maintaining SPP’s 1-day-in-10-years Loss of Load Expectation standard.
In SPP, four-hour duration represents the minimum threshold for full capacity participation. Storage resources with shorter durations are derated to a four-hour equivalent, for example two-hour battery is evaluated on the four-hour ELCC curve and is effectively limited to about 50% of nameplate capacity.
Additionally, in SPP the ELCC accreditation is assigned through a tiered, duration-based priority process order. Tier 1 resources, those with firm transmission service, receive their accreditation first. Tier 2 resources without firm service then receive whatever remaining ELCC capacity exists after Tier 1 allocations. The allocation sequence proceeds as follows: eight-hour Tier 1 resources, then eight-hour Tier 2, then six-hour Tier 1, six-hour Tier 2, four-hour Tier 1, four-hour Tier 2, and finally two-hour systems. This hierarchy creates clear incentives for developers to secure firm transmission service and consider longer-duration configurations.
SPP publishes ELCC values annually, producing summer accreditation factors by October 1 and winter factors by April 1. At current penetration levels below 1 GW (423 MW as of Dec. 2025), SPP’s ELCC study results show remarkably favorable accreditation:
| Duration | Summer ELCC (1 GW Penetration)10 | Summer ELCC (High Penetration)11 |
| 2 – hour | 50% | 32.6% |
| 4 – hour | 100% | 65.2% |
| 6 – hour | 100% | 94.4% |
| 8 – hour | 100% | 100% |
Winter accreditation presents the more significant challenge for battery developers. Because winter reliability events involve extended cold events lasting hours to days rather than brief evening peaks, duration-limited resources provide less reliability value:
| Duration | Winter ELCC (1 GW Penetration)12 | Winter ELCC (High Penetration)13 |
| 2 – hour | 50% | 23.9% |
| 4 – hour | 100% | 47.7% |
| 6 – hour | 100% | 74.9% |
| 8 – hour | 100% | 74.9% |
These values decline as total storage deployment increases, a phenomenon called “saturation” where adding more duration-limited resources provides diminishing reliability benefits. By the time SPP reaches higher installed storage capacity, four-hour systems will receive only 65.2% accreditation in summer and 47.7% accreditation in winter.
Deficiency penalties create effective price floors
LREs failing to demonstrate sufficient contracted capacity face deficiency payments calculated as:
Deficiency Payment = Deficient MW × CONE × CONE Factor
The CONE Factor varies based on the overall SPP Balancing Authority Area reserve margin:
| BA Area Reserve Margin Excess | CONE Factor |
| ≤3% above requirement | 200% |
| 3-8% above requirement | 150% |
| ≥8% above requirement | 125% |
At the current $85.61/kW-year CONE and 2x CONE Factor, maximum deficiency payments reach approximately $171/kW-year ($14.20/kW-month). But when CONE rises to $139.85/kW-year in 2026, maximum penalties would reach approximately $280/kW-year ($23.30/kW-month).
Max Deficiency Payments Increase from ~$171/kW-yr (2025) to ~$280/kW-yr in 2026 as CONE Rises 2025 vs 2026 CONE Outlook| $/kW-year
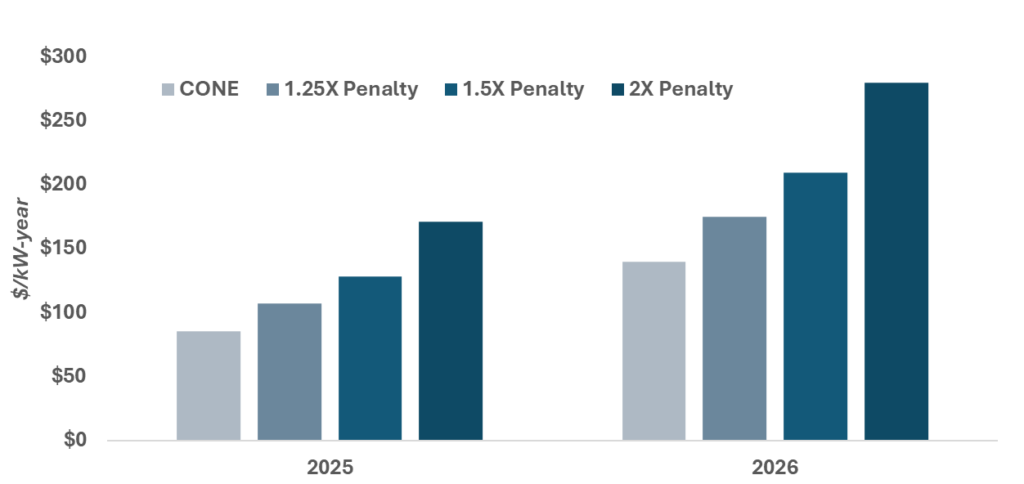
Figure 4: CONE and Deficiency Penalty Escalation
A Sufficiency Valuation Curve temporarily softens penalties during the two years14 following PRM increases. However, as reserve margins tighten toward the projected 5% level by 2029, full deficiency penalties will apply, establishing a meaningful price floor for capacity contracts.
What This Means for Wholesale Revenue
The resource adequacy dynamics described above don’t exist in a policy vacuum, they directly shape the wholesale revenue environment for every generator in the SPP footprint, especially battery storage. Tightening reserve margins correlate with increased frequency and magnitude of scarcity pricing events in the day-ahead and real-time markets. Production cost modeling that captures these dynamics at the nodal level is essential for accurate revenue forecasting so that your resource, especially battery storage, can capture these high-price intervals.
Battery storage’s fast ramping characteristics make it well-suited for regulation and spinning reserve services. As SPP manages increasing wind variability and the integration of more solar generation, ancillary service volumes and prices are expected to grow. Revenue stacking (combining energy arbitrage, ancillary services, and RA capacity payments)is the foundation of BESS economics in SPP.
The Open Question: Are Battery Storage actually getting built?
Everything discussed above, the capacity gap, the ELCC window, the rising deficiency penalties, the wholesale revenue, points to a market that urgently needs new resources. But understanding needs is only half the equation. The other half is understanding whether, and how quickly, those resources can actually interconnect to SPP’s transmission system.
SPP’s interconnection queue currently exceeds 130 GW of total generation capacity, of which 20% is battery storage and 17% is hybrid -. Queue timelines have extended. Cluster study cycles have been reformed and the strategic choices developers make about where to interconnect – which zone, which node, which transmission corridor -determine not just whether a project can reach the grid, but how much of the market opportunity it can capture.
In Part 2 of this series, CES will provide a comprehensive analysis of SPP’s interconnection queue: how the cluster study process works, what the queue data reveals about regional development patterns, and how project siting strategy directly shapes project economics and wholesale revenue.